


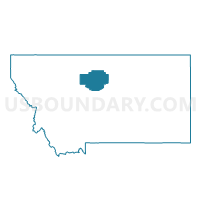
Census Tract 103, Chouteau County, Montana
About
Outline

Summary
| Unique Area Identifier | 470506 |
| Name | Census Tract 103 |
| County | Chouteau County |
| State | Montana |
| Area (square miles) | 2,910.28 |
| Land Area (square miles) | 2,890.64 |
| Water Area (square miles) | 19.64 |
| % of Land Area | 99.33 |
| % of Water Area | 0.67 |
| Latitude of the Internal Point | 47.86065580 |
| Longtitude of the Internal Point | -110.21673090 |
| Total Population | 3,688 |
| Total Housing Units | 1,722 |
| Total Households | 1,352 |
| Median Age | 35 |
Maps

Graphs
Select a template below for downloading or customizing gragh for Census Tract 103, Chouteau County, Montana


Neighbors
Neighoring Census Tract (by Name) Neighboring Census Tract on the Map
- Census Tract 1, Judith Basin County, MT
- Census Tract 101, Cascade County, MT
- Census Tract 102, Chouteau County, MT
- Census Tract 106, Cascade County, MT
- Census Tract 2, Blaine County, MT
- Census Tract 301, Fergus County, MT
- Census Tract 401, Hill County, MT
- Census Tract 402, Hill County, MT
- Census Tract 9403, Hill County, MT
Top 10 Neighboring County Subdivision (by Population) Neighboring County Subdivision on the Map
- Havre CCD, Hill County, MT (12,004)
- Great Falls North CCD, Cascade County, MT (3,746)
- Big Sandy CCD, Chouteau County, MT (2,513)
- Chinook CCD, Blaine County, MT (2,410)
- Fort Benton CCD, Chouteau County, MT (2,357)
- Rocky Boy's CCD, Hill County, MT (2,271)
- Belt CCD, Cascade County, MT (2,011)
- Geraldine CCD, Chouteau County, MT (943)
- Gildford CCD, Hill County, MT (814)
- Denton CCD, Fergus County, MT (561)
Top 10 Neighboring Place (by Population) Neighboring Place on the Map
- Rocky Boy West CDP, MT (890)
- Big Sandy town, MT (598)
- Boneau CDP, MT (380)
- Rocky Boy's Agency CDP, MT (355)
- St. Pierre CDP, MT (350)
- Parker School CDP, MT (340)
- Sangrey CDP, MT (306)
- Geraldine town, MT (261)
- Highwood CDP, MT (176)
- Loma CDP, MT (85)
Top 10 Neighboring Elementary School District (by Population) Neighboring Elementary School District on the Map
- Great Falls Elementary School District, MT (72,018)
- Havre Elementary School District, MT (12,252)
- Rocky Boy Elementary School District, MT (3,005)
- Chester-Joplin-Inverness Elementary School District, MT (2,190)
- Belt Elementary School District, MT (2,106)
- Fort Benton Elementary School District, MT (1,890)
- Big Sandy Elementary School District, MT (1,166)
- North Star Elementary School District, MT (966)
- Geraldine Elementary School District, MT (625)
- Denton Elementary School District, MT (527)
Top 10 Neighboring Secondary School District (by Population) Neighboring Secondary School District on the Map
- Great Falls High School District, MT (72,159)
- Havre High School District, MT (12,655)
- Harlem High School District, MT (2,533)
- Chester-Joplin-Inverness High School District, MT (2,463)
- Big Sandy High School District, MT (2,415)
- Chinook High School District, MT (2,333)
- Fort Benton High School District, MT (2,296)
- Belt High School District, MT (2,008)
- Rocky Boy High School District, MT (1,784)
- North Star High School District, MT (1,112)
Top 10 Neighboring Unified School District (by Population) Neighboring Unified School District on the Map
Top 10 Neighboring State Legislative District Lower Chamber (by Population) Neighboring State Legislative District Lower Chamber on the Map
- State House District 19, MT (9,944)
- State House District 28, MT (9,406)
- State House District 32, MT (9,338)
- State House District 29, MT (8,625)
- State House District 24, MT (8,207)
- State House District 33, MT (8,198)
Top 10 Neighboring State Legislative District Upper Chamber (by Population) Neighboring State Legislative District Upper Chamber on the Map
- State Senate District 16, MT (18,529)
- State Senate District 10, MT (18,254)
- State Senate District 14, MT (18,201)
- State Senate District 15, MT (17,708)
- State Senate District 12, MT (16,293)
- State Senate District 17, MT (16,119)
Top 10 Neighboring 111th Congressional District (by Population) Neighboring 111th Congressional District on the Map
Top 10 Neighboring 5-Digit ZIP Code Tabulation Area (by Population) Neighboring 5-Digit ZIP Code Tabulation Area on the Map
- 59405, MT (31,438)
- 59404, MT (26,867)
- 59501, MT (12,638)
- 59521, MT (3,475)
- 59442, MT (1,789)
- 59412, MT (1,747)
- 59520, MT (1,030)
- 59446, MT (564)
- 59450, MT (467)
- 59430, MT (454)
Data
Demographic, Population, Households, and Housing Units
** Data sources from census 2010 **
Show Data on Map
Download Full List as CSV
Download Quick Sheet as CSV
| Subject | This Area | Chouteau County | Montana | National |
|---|---|---|---|---|
| POPULATION | ||||
| Total Population Map | 3,688 | 5,813 | 989,415 | 308,745,538 |
| POPULATION, HISPANIC OR LATINO ORIGIN | ||||
| Not Hispanic or Latino Map | 3,610 | 5,719 | 960,850 | 258,267,944 |
| Hispanic or Latino Map | 78 | 94 | 28,565 | 50,477,594 |
| POPULATION, RACE | ||||
| White alone Map | 2,348 | 4,409 | 884,961 | 223,553,265 |
| Black or African American alone Map | 2 | 3 | 4,027 | 38,929,319 |
| American Indian and Alaska Native alone Map | 1,260 | 1,267 | 62,555 | 2,932,248 |
| Asian alone Map | 11 | 21 | 6,253 | 14,674,252 |
| Native Hawaiian and Other Pacific Islander alone Map | 5 | 6 | 668 | 540,013 |
| Some Other Race alone Map | 6 | 16 | 5,975 | 19,107,368 |
| Two or More Races Map | 56 | 91 | 24,976 | 9,009,073 |
| POPULATION, SEX | ||||
| Male Map | 1,823 | 2,861 | 496,667 | 151,781,326 |
| Female Map | 1,865 | 2,952 | 492,748 | 156,964,212 |
| POPULATION, AGE (18 YEARS) | ||||
| 18 years and over Map | 2,548 | 4,262 | 765,852 | 234,564,071 |
| Under 18 years | 1,140 | 1,551 | 223,563 | 74,181,467 |
| POPULATION, AGE | ||||
| Under 5 years | 315 | 415 | 62,423 | 20,201,362 |
| 5 to 9 years | 318 | 431 | 60,765 | 20,348,657 |
| 10 to 14 years | 294 | 413 | 61,124 | 20,677,194 |
| 15 to 17 years | 213 | 292 | 39,251 | 12,954,254 |
| 18 and 19 years | 104 | 141 | 27,473 | 9,086,089 |
| 20 years | 47 | 58 | 13,789 | 4,519,129 |
| 21 years | 42 | 62 | 13,517 | 4,354,294 |
| 22 to 24 years | 133 | 168 | 39,832 | 12,712,576 |
| 25 to 29 years | 191 | 283 | 64,123 | 21,101,849 |
| 30 to 34 years | 186 | 274 | 58,741 | 19,962,099 |
| 35 to 39 years | 184 | 265 | 55,575 | 20,179,642 |
| 40 to 44 years | 184 | 317 | 57,370 | 20,890,964 |
| 45 to 49 years | 236 | 394 | 71,021 | 22,708,591 |
| 50 to 54 years | 267 | 452 | 78,811 | 22,298,125 |
| 55 to 59 years | 262 | 471 | 75,915 | 19,664,805 |
| 60 and 61 years | 97 | 158 | 27,095 | 7,113,727 |
| 62 to 64 years | 134 | 211 | 35,848 | 9,704,197 |
| 65 and 66 years | 75 | 125 | 19,811 | 5,319,902 |
| 67 to 69 years | 72 | 163 | 26,745 | 7,115,361 |
| 70 to 74 years | 106 | 225 | 34,186 | 9,278,166 |
| 75 to 79 years | 114 | 195 | 25,637 | 7,317,795 |
| 80 to 84 years | 67 | 152 | 20,342 | 5,743,327 |
| 85 years and over | 47 | 148 | 20,021 | 5,493,433 |
| MEDIAN AGE BY SEX | ||||
| Both sexes Map | 35.00 | 41.50 | 39.80 | 37.20 |
| Male Map | 35.10 | 40.80 | 38.80 | 35.80 |
| Female Map | 35.00 | 42.10 | 41.00 | 38.50 |
| HOUSEHOLDS | ||||
| Total Households Map | 1,352 | 2,294 | 409,607 | 116,716,292 |
| HOUSEHOLDS, HOUSEHOLD TYPE | ||||
| Family households: Map | 978 | 1,560 | 257,087 | 77,538,296 |
| Husband-wife family Map | 709 | 1,200 | 201,611 | 56,510,377 |
| Other family: Map | 269 | 360 | 55,476 | 21,027,919 |
| Male householder, no wife present Map | 94 | 129 | 18,431 | 5,777,570 |
| Female householder, no husband present Map | 175 | 231 | 37,045 | 15,250,349 |
| Nonfamily households: Map | 374 | 734 | 152,520 | 39,177,996 |
| Householder living alone Map | 340 | 667 | 121,775 | 31,204,909 |
| Householder not living alone Map | 34 | 67 | 30,745 | 7,973,087 |
| HOUSEHOLDS, HISPANIC OR LATINO ORIGIN OF HOUSEHOLDER | ||||
| Not Hispanic or Latino householder: Map | 1,340 | 2,279 | 401,678 | 103,254,926 |
| Hispanic or Latino householder: Map | 12 | 15 | 7,929 | 13,461,366 |
| HOUSEHOLDS, RACE OF HOUSEHOLDER | ||||
| Householder who is White alone | 1,015 | 1,940 | 379,280 | 89,754,352 |
| Householder who is Black or African American alone | 0 | 0 | 1,245 | 14,129,983 |
| Householder who is American Indian and Alaska Native alone | 320 | 323 | 18,263 | 939,707 |
| Householder who is Asian alone | 2 | 5 | 1,909 | 4,632,164 |
| Householder who is Native Hawaiian and Other Pacific Islander alone | 1 | 1 | 231 | 143,932 |
| Householder who is Some Other Race alone | 3 | 5 | 1,889 | 4,916,427 |
| Householder who is Two or More Races | 11 | 20 | 6,790 | 2,199,727 |
| HOUSEHOLDS, HOUSEHOLD TYPE BY HOUSEHOLD SIZE | ||||
| Family households: Map | 978 | 1,560 | 257,087 | 77,538,296 |
| 2-person household Map | 426 | 766 | 129,321 | 31,882,616 |
| 3-person household Map | 176 | 294 | 52,940 | 17,765,829 |
| 4-person household Map | 158 | 227 | 43,033 | 15,214,075 |
| 5-person household Map | 124 | 163 | 20,021 | 7,411,997 |
| 6-person household Map | 50 | 61 | 7,461 | 3,026,278 |
| 7-or-more-person household Map | 44 | 49 | 4,311 | 2,237,501 |
| Nonfamily households: Map | 374 | 734 | 152,520 | 39,177,996 |
| 1-person household Map | 340 | 667 | 121,775 | 31,204,909 |
| 2-person household Map | 32 | 59 | 24,654 | 6,360,012 |
| 3-person household Map | 2 | 8 | 4,106 | 992,156 |
| 4-person household Map | 0 | 0 | 1,374 | 411,171 |
| 5-person household Map | 0 | 0 | 445 | 126,634 |
| 6-person household Map | 0 | 0 | 102 | 48,421 |
| 7-or-more-person household Map | 0 | 0 | 64 | 34,693 |
| HOUSING UNITS | ||||
| Total Housing Units Map | 1,722 | 2,879 | 482,825 | 131,704,730 |
| HOUSING UNITS, OCCUPANCY STATUS | ||||
| Occupied Map | 1,352 | 2,294 | 409,607 | 116,716,292 |
| Vacant Map | 370 | 585 | 73,218 | 14,988,438 |
| HOUSING UNITS, OCCUPIED, TENURE | ||||
| Owned with a mortgage or a loan Map | 276 | 599 | 171,236 | 52,979,430 |
| Owned free and clear Map | 549 | 908 | 107,182 | 23,006,644 |
| Renter occupied Map | 527 | 787 | 131,189 | 40,730,218 |
| HOUSING UNITS, VACANT, VACANCY STATUS | ||||
| For rent Map | 28 | 83 | 10,082 | 4,137,567 |
| Rented, not occupied Map | 5 | 7 | 773 | 206,825 |
| For sale only Map | 25 | 34 | 5,964 | 1,896,796 |
| Sold, not occupied Map | 5 | 6 | 1,353 | 421,032 |
| For seasonal, recreational, or occasional use Map | 122 | 180 | 38,510 | 4,649,298 |
| For migrant workers Map | 2 | 3 | 283 | 24,161 |
| Other vacant Map | 183 | 272 | 16,253 | 3,652,759 |
| HOUSING UNITS, OCCUPIED, AVERAGE HOUSEHOLD SIZE BY TENURE | ||||
| Total: Map | 2.71 | 2.48 | 2.35 | 2.58 |
| Owner occupied Map | 2.37 | 2.31 | 2.42 | 2.65 |
| Renter occupied Map | 3.25 | 2.80 | 2.18 | 2.44 |
| HOUSING UNITS, OCCUPIED, TENURE BY RACE OF HOUSEHOLDER | ||||
| Owner occupied: Map | 825 | 1,507 | 278,418 | 75,986,074 |
| Householder who is White alone Map | 759 | 1,433 | 263,920 | 63,446,275 |
| Householder who is Black or African American alone Map | 0 | 0 | 380 | 6,261,464 |
| Householder who is American Indian and Alaska Native alone Map | 54 | 54 | 8,800 | 509,588 |
| Householder who is Asian alone Map | 2 | 4 | 946 | 2,688,861 |
| Householder who is Native Hawaiian and Other Pacific Islander alone Map | 1 | 1 | 107 | 61,911 |
| Householder who is Some Other Race alone Map | 2 | 4 | 819 | 1,975,817 |
| Householder who is Two or More Races Map | 7 | 11 | 3,446 | 1,042,158 |
| Renter occupied: Map | 527 | 787 | 131,189 | 40,730,218 |
| Householder who is White alone Map | 256 | 507 | 115,360 | 26,308,077 |
| Householder who is Black or African American alone Map | 0 | 0 | 865 | 7,868,519 |
| Householder who is American Indian and Alaska Native alone Map | 266 | 269 | 9,463 | 430,119 |
| Householder who is Asian alone Map | 0 | 1 | 963 | 1,943,303 |
| Householder who is Native Hawaiian and Other Pacific Islander alone Map | 0 | 0 | 124 | 82,021 |
| Householder who is Some Other Race alone Map | 1 | 1 | 1,070 | 2,940,610 |
| Householder who is Two or More Races Map | 4 | 9 | 3,344 | 1,157,569 |
| HOUSING UNITS, OCCUPIED, TENURE BY HISPANIC OR LATINO ORIGIN OF HOUSEHOLDER | ||||
| Owner occupied: Map | 825 | 1,507 | 278,418 | 75,986,074 |
| Not Hispanic or Latino householder Map | 821 | 1,500 | 274,612 | 69,617,625 |
| Hispanic or Latino householder Map | 4 | 7 | 3,806 | 6,368,449 |
| Renter occupied: Map | 527 | 787 | 131,189 | 40,730,218 |
| Not Hispanic or Latino householder Map | 519 | 779 | 127,066 | 33,637,301 |
| Hispanic or Latino householder Map | 8 | 8 | 4,123 | 7,092,917 |
| HOUSING UNITS, OCCUPIED, TENURE BY HOUSEHOLD SIZE | ||||
| Owner occupied: Map | 825 | 1,507 | 278,418 | 75,986,074 |
| 1-person household Map | 212 | 394 | 66,631 | 16,453,569 |
| 2-person household Map | 354 | 667 | 118,084 | 27,618,605 |
| 3-person household Map | 107 | 206 | 38,883 | 12,517,563 |
| 4-person household Map | 84 | 132 | 32,324 | 10,998,793 |
| 5-person household Map | 46 | 73 | 14,473 | 5,057,765 |
| 6-person household Map | 11 | 19 | 5,172 | 1,965,796 |
| 7-or-more-person household Map | 11 | 16 | 2,851 | 1,373,983 |
| Renter occupied: Map | 527 | 787 | 131,189 | 40,730,218 |
| 1-person household Map | 128 | 273 | 55,144 | 14,751,340 |
| 2-person household Map | 104 | 158 | 35,891 | 10,624,023 |
| 3-person household Map | 71 | 96 | 18,163 | 6,240,422 |
| 4-person household Map | 74 | 95 | 12,083 | 4,626,453 |
| 5-person household Map | 78 | 90 | 5,993 | 2,480,866 |
| 6-person household Map | 39 | 42 | 2,391 | 1,108,903 |
| 7-or-more-person household Map | 33 | 33 | 1,524 | 898,211 |
Loading...